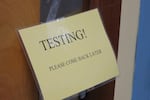
A sign on a computer lab at Portland's Abernethy Elementary School tells students and staff to stay out, while state testing takes place.
Rob Manning / OPB
Oregon’s latest summative test data show incremental progress in some areas. But overall, the state is still behind pre-pandemic performance levels, and the percentages of students who are proficient in math, English and science remain staggeringly low.
The Oregon Department of Education released its standardized assessment data on Thursday. The results, which reflect student testing this past spring, are a one-time snapshot of the state’s educational system.
Students in grades 3-8 and 11 are tested in math and English, and depending on their grades, science. Along with things like graduation rates, these results are one of the only statewide, annual touchpoints to understand the health of Oregon’s school system.
And what that snapshot shows isn’t great.
Less than half of all students tested statewide are proficient in English language arts. Less than a third are proficient in math. And slightly over a quarter of tested students are proficient in science.
These rates change dramatically when broken down by socioeconomic groups. Though there were some gains in individual groups, far fewer students experiencing poverty, English language learners, and students with disabilities tested as proficient compared to statewide averages. The same was true for students who are Black, Hispanic/Latino, Native Hawaiian/Pacific Islander or American Indian/Alaska Native.
“Every child deserves a high-quality, culturally responsive public education to be set up for success. I’m not satisfied with this year’s numbers,” Gov. Tina Kotek said in a press release about the data. “We must double down on our commitment and collaboration to fix the gaps in our system that are failing students.”
The recent data also highlights an alarming fact: Large numbers of students aren’t just below proficiency — they’re below minimum grade-level standards.
Students’ results are categorized into four levels. Levels 3 and 4 show students are proficient or advanced in each subject area as compared to grade-level standards. For 11th graders, proficiency also equates to being college- and career-ready.
Level 2 shows students whose performance is consistent with core grade-level knowledge and skills but who have a limited range of complexity and, therefore, are not considered “proficient.”
Level 1, the lowest level, means they’re below even minimum grade-level standards.
Every single grade in every subject area in the latest data showed more students marked as Level 1 than any other level. The one exception was fifth-grade science, where Level 1 and Level 2 were nearly tied.
In a couple of cases — such as eighth-grade and eleventh-grade math — half or more of all students tested came in at Level 1, meaning there are as many students below grade level as there are meeting or above it.
ODE Director Charlene Williams said this speaks to the range of learners teachers face in a classroom.
These results, she said, present a “challenge and the opportunity.” Williams posed the question on a call with reporters: “‘Well, what is it going to take to help move the needle, especially with our students who have been performing at Level 1?’”
State officials stressed that scores aren’t used to grade individual educators’ or students’ abilities. The results should be used to see generally what is and isn’t working.
School and district administrators look at this data for broad analysis. If they notice students are testing at Level 1 because they are struggling with a particular idea or concept, Williams explained, the staff can work together to develop new strategies, curriculum options and other resources to address those specific needs.
“Do we need more time after school? Do we need to restructure our schedule?” Williams gave as examples. “Do we need to co-design lessons in our … professional learning communities, where teachers gather together, look at student data [and] exchange ideas on how to teach and reach students?”
By the time students take the exams, and initial results are available to school and state officials in the spring, Williams said the school year has mostly wrapped up. But the scores can be used when planning for the coming school year.
“There are trends and patterns we can anticipate where students are going to need some additional supports,” she said. “How do we leverage that anticipation and the evidence that we have in front of us to design a better path moving forward?”
And all of this data should be taken with a large caveat. After all, though participation rates are up this year, they still aren’t meeting federally mandated levels. This means state officials don’t have as large a pool to analyze from as they want for more accurate results.
Federal law requires participation from at least 95% of all students, and 95% of students in every subgroup. Year after year, Oregon does not meet that standard.
ODE officials quantify “sufficient participation” as above 80%. But even ODE’s lower bar for participation is too high for some students. Eleventh graders’ participation rates are in the high 60s and low 70s for each subject, though they are up slightly this year compared to the last two years. Participation rates that low make officials less certain about drawing conclusions from the data.
A large reason for this is that Oregon is one of only a few states — Colorado is another, for example — that gives families the choice to opt out of standardized tests. Senate Bill 1583 directs the state education department to submit a waiver every year to the federal government as a result.
There are also some groups who are advocating for less testing overall, arguing that preparing for the tests is not an effective use of classroom time and that the tests don’t properly measure students’ academic abilities.
State officials said continued and increased investments in literacy across the state and improving after-school and summer learning programs are among their priorities moving forward.
View the full results, including statewide and individual district or school data, online here.
