
State officials are inching closer to understanding the scale of nitrate pollution in Eastern Oregon drinking water. That is after the state released data that pinpoints the location of where contamination is found in the region, but local advocates say the map fails to protect residents’ privacy.
The Oregon Health Authority released updated data, including four maps, that show the scale of nitrate contamination in domestic well water in Morrow and Umatilla counties. Groundwater in the region has been polluted with nitrate contamination for more than 30 years. It was designated a groundwater management area in 1990 known as the Lower Umatilla Basin Groundwater Management Area or LUBGWMA.
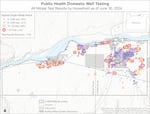
The Oregon Health Authority has released maps that show nitrate levels found in domestic well water in parts of Morrow and Umatilla counties.
Oregon Health Authority
If ingested at levels of more than 10 milligrams per liter, nitrate contamination can cause health effects like respiratory infections, thyroid dysfunction and stomach or bladder cancer, according to the Environmental Protection Agency.
OHA’s Environmental Public Health Section Manager Gabriela Goldfarb said the agency worked with many local agencies and community-based organizations for the past 15 months to have a better understanding of the issue.
“The main purpose of the maps is to help show the public what’s happening on the ground or rather in the groundwater under their homes,” she said. The agency has shared the data in numerical form, she said, “but it’s sometimes easier to see things in a map.”
The maps show nitrate levels in domestic well water, with levels from none detected to more than 25 milligrams per liter, for more than 1,700 households in the region. The well testing was part of Gov. Tina Kotek’s goals for the region. They included contacting all domestic well users in the area and publishing a web map of domestic wells tested by July 31.
“It is encouraging that more than 1,700 households in the LUBGWMA have accessed free well water testing, but we hope many more residents will test their wells and make sure their family’s drinking water is safe,” Goldfarb said in a statement. “As the maps show, nitrate levels can vary greatly even within a small area. The only way to know is to request a free laboratory test.”
The state’s efforts to better understand the nitrate contamination in Morrow and Umatilla counties have had a slow start. But a yearlong effort to contact all domestic well users in the region and provide free testing has led to the creation of the recently released maps that state officials say will help with organization and contacting more households in the area.
The more than 1,700 households tested are out of more than 3,200 households OHA has identified with domestic wells in the region.
The maps could help the agency and its partners better identify where to focus their resources and work on ways to improve communication with the public, Goldfarb said.
“We’re feeling fairly confident that we can get a good picture and it’s helping us to organize things like sending out our letters to folks who need to have retesting,” she said.
One of the main groups the agency is focusing on are households that tested between 5 to 10 milligrams per liter, Goldfarb said.
“We’re worried about them for two reasons, their water is safe to drink right now, but we know that the nitrate levels in the groundwater are still continuing to rise,” she said. “…Those folks who are close to 10, we want to make sure that at no point in the year, are they going over 10 milligrams per liter and so these maps kind of show that there’s a good group of folks who we really need to be retesting.”
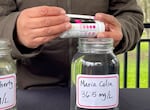
FILE -A rapid test on a jar of well water from Boardman, Ore., finds nitrate levels above the federal standard of 10 milligrams per liter.
Monica Samayoa / OPB
Of the 1,706 households, 432 are testing in that range, according to the data.
Goldfarb said these homes will be retested every three months. If, after one year, their levels do not go over 10 mg per liter, they will switch to annual retesting.
“If at any point, their tests go above, during that one year of quarterly testing, then we would immediately put them on water delivery and sign them up, put them on the list for a water treatment system,” she said.
So far, 111 households have received water treatment installations.
The agency will continue to work on improving ways to contact households that were not tested and will continue to retest wells of households whose water tests showed between 5 milligrams and 10 milligrams of nitrates per liter of water.
“We are really in kind of an ongoing implementation mode for the next year,” she said.
Concerns about household privacy
Oregon Rural Action’s Director of Policy and Research Kaleb Lay criticized the state’s nitrate maps, saying they fall short in protecting the privacy of residents.
“You can just look at the map and see where individual households are and where they’re testing,” he said.
Lay said the agency should have created a map similar to one Umatilla country created that shows a range of nitrate density, like a heat map. Another suggestion would be to “blurring the edges” to protect individual privacy, Lay said.
“People have been pretty clear that they want their privacy to be respected, they have a right to privacy,” he said. “They don’t want any of their private information disclosed, they have concerns that this could affect their property values and they just don’t want to be on some list somewhere.”
OHA’s Goldfarb said there are no street names on the maps other than the main highway. She said the circles on the map are a certain size to provide ambiguity as to a location of a property and the map is non-interactive, so it cannot provide more underlying information.