
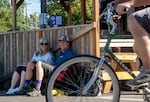
Kathy Sloan, left, and David Weymann count a bicyclist in front of Clinton Street Theater in Portland, Ore., on July 11, 2024. They are two of over 100 volunteers who help the city of Portland collect data about where bikers are in the city.
Lillian Karabaic / OPB
Each summer for more than 30 years, over 100 volunteers spend rush hour at intersections across Portland to tally vehicles. Yet they’re not counting car bumpers, but bike bells — it’s the city’s annual bicycle count.
“It’s fun. It’s really interesting to see people go by in all different bikes and all different shapes and sizes and speeds and levels of confidence — and wearing different outfits,” said David Weymann, who has been volunteering with the bike count since 2016.
The count is organized by the Portland Bureau of Transportation, in an effort to better understand who is biking, where, and how it is changing over time.
Most cities get their data about biking from the U.S. Census “Journey to Work” survey, but that’s missing information about people who ride bikes for fun, errands, or to school. And it doesn’t tell city planners the information they need to know to build new bike infrastructure — where people are biking.
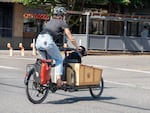
A person bikes on Southeast Clinton Street on July 11, 2024. Dogs and kids are common passengers on the Southeast Clinton neighborhood greenway. However, the Portland bicycle count only tallies passengers that can pedal.
Lillian Karabaic / OPB
Portland’s is the longest-running annual bike count in the country, according to the city, even as other cities have eclipsed Portland’s status as the top-tier North American biking city.
And while there are automated counters, human counters can capture a more complete picture of who is on the bikes. “There are definitely trends. The people that are riding the (Biketown bikes) are often not wearing helmets, no surprises. And women tend to wear helmets more often than men,” said Kathy Sloan.
Sloan is high school math teacher who has helped with the count for three years. As a mathematician, she likes the statistics. “I like the data and I like seeing how it changes and varies depending on where we are. And, I’m currently trying to think of some way I could integrate this as a lesson into one of my units next year.”
Related: New Portland city data shows cycling up 5% from 2022
The bike count data has also helped show how improvements in the bikeway network can change the makeup of riders. Citywide, men outnumber women on bikes two to one, according to the 2023 Portland Bicycle Counts report, but some intersections that are located on close-in low-traffic neighborhood greenways ranked close to 50 percent women last year.
Weymann and Sloan were at Southeast Clinton Street and 26th Avenue for the annual count on Thursday. It’s one of over 300 intersections that will be counted by volunteers this summer from June 4 to Sept. 26, and is one of the busier ones. “It’s bike throughway, and so there’s a lot of bikes coming and going through this intersection,” said Sloan.

David Weymann and Kathy Sloan stand next to Portland Bureau of Transportation's Public Information Officer Dylan Riviera. Weymann has been volunteering for the bike count since 2016 because he says the data is useful to PBOT and the agency uses the data for a good purpose.
Lillian Karabaic / OPB
They had the tools of the bike counting trade: clipboards and Pentel 0.7 mm mechanical pencils. “You can do just about anything you want with a clipboard in your hand,” joked Weymann.
Because this is a busy intersection, they divvied up the tasks. Weymann, who is a civil environmental engineer, drew the diagrams of bikers’ paths through the intersection.
“He’s very good at making really organized tick marks,” Sloan said while she will count the gender split, helmet use, e-bikes and micro-mobility vehicles such as scooters and skateboards, or what the National Association of City Transportation calls “small things with wheels.”
And sometimes they threw in a bonus statistic. “Dave decided to do an additional count of how many people were willing to wave back if we gave him a little wave and the different types of wave, and so we recorded that as well,” Sloan said of a time when they counted on the Burnside Bridge.

David Weymann filled out this bike counting diagram of Portland's Ladd Circle.
Lillian Karabaic / OPB
Weymann said the challenge was they then had to decide what constituted a wave: “Did a flick of the finger count as a wave? Does an enthusiastic handshake count as a wave?”
Sloan said the data revealed that “Portland bikers are really friendly — they almost all waved!”
On the day they’re set to count, Portland had just come out of a weeklong heat wave with temperatures topping 100 F. They’re not sure people would be ready to jump on their bikes again. But at 4 p.m., mechanical pencils ready, they started making ticks on their sheet as bikes roll past. “You have to stay organized in your tick marks because if they get piled up, you’ll run out of space,” said Sloan.
The timing of the bike counts is strict. “We start exactly at four and we end exactly at six. And anybody that comes a few seconds before four does not get counted. And if you’re just right after six, I’m so sorry,” said Sloan.
Over the next two hours, they filled up four sheets with tick marks, working steadily. Sloan had to look twice to see if some bikes were e-bikes. “If they’re zipping along three times as fast as everybody else, I look a little more,” she said. The city only started counting e-bikes last year, which is also the first year biking started to increase again after a seven-year decline.
At 6 p.m. sharp, the stopped counting and cross-checked their counts. Total? More than 450. “We’re rocking it! This is a good intersection,” exclaimed Weymann.
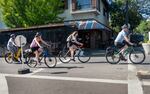
Rush hour bikers ride on Clinton Street in Southeast Portland during the Portland summer bike count. The bike count data helps determine where people are biking.
Lillian Karabaic / OPB
And as they packed up their chairs and clipboards, a Pedalpalooza ride with about 40 riders in search of free Slurpees for 7-Eleven Day rolled past. They’re just a few minutes too late to be counted.
But there’s always next year. Weymann said the beautiful thing about the counts is they show a slice of Portland’s people. “It’s just a really wonderful cross section of the city and we’re all trying to navigate on bicycles through this beautiful city that we love.”
And volunteers like Weymann and Sloan will be there to capture it — one tick mark at a time.