Portlanders can now track efforts to reduce greenhouse gas emissions and reach the city’s overall climate goals in a new interactive dashboard.
The Portland Bureau of Planning and Sustainability’s Climate and Energy Dashboard tracks Multnomah County’s progress toward the goal of eliminating carbon emissions by 2050. The dashboard, which uses climate and energy goals from the Climate Emergency Declaration, the Climate Emergency Workplan and Portland’s 100% Renewable Energy Resolution, makes it easier for people to see how far along the city is with its adopted goals.
The Bureau of Planning and Sustainability has been collecting Multnomah County carbon emissions data for more than 30 years, climate policy analyst Kyle Diesner said, but it was not always publicly accessible.

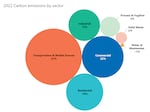
A grouped bubble chart showing carbon emissions by sector in Multnomah County, one of a number of charts displayed on a new Portland Climate and Energy dashboard.
Portland Bureau of Planning and Sustainability
“In the past, we would publish it in our climate action plans and periodic progress reports but really people had to request the data from the Bureau if they wanted to dig into it,” he said.
It was Diesner’s idea to create the dashboard so the data could be easily accessible to the public and be transparent as to how far along the city is with its goals.
“This is really stepping into that space with our climate data and hoping that this adds value for the public, for academics, for other policy analysts, both at the city and around the world,” he said.
The dashboard has several graphs and charts that show total carbon emissions since 1990 and carbon emissions by sector and neighborhood solar installations.
“Each of the charts, you have the ability to really dig into them, look at different metrics within them, download the data so you can analyze it on your own offline,” he said.
According to the dashboard, renewable electricity supplies 46% of Multnomah County’s power. The goal is 100% renewable by 2030. And there are 1.1% community-owned renewable energy generation assets, like community solar and net-metered solar systems, in the city. That goal is 2% by 2030.
As of 2022, Multnomah County is recording carbon emission levels 21% below 1990.
The reductions in emissions are driven by a number of changes, including the growing use of energy-efficient appliances, electric vehicles and rooftop solar. Emissions from landfills are also down because of composting and recycling.

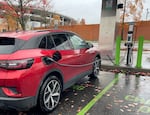
An electric vehicle is charging at Oregon Museum of Science and Industry's parking lot in this Nov. 11, 2024 file photo. OMSI partnered with Portland General Electric's Drive Fund to add EV stations at OMSI. From July through October, the chargers have reduced more than 2,600 pounds of CO2 from the atmosphere.
Monica Samayoa / OPB
City initiatives and funds like the Portland Clean Energy Fund have also helped lower overall emissions.
“Hopefully folks can see themselves in this data — represented through the residential sector, the commercial sector, if they work for a company through their transportation choices — and hopefully they can see opportunities within their own life where they can implement changes to reduce these emissions by putting the data out here,” Diesner said. “I’m hopeful that people will have a better understanding of their own contributions.”
But there is still work left to do to meet the next climate benchmarks, by 2030. That next benchmark seeks to reduce emissions to 50% below 1990 levels.
Diesner said, right now, Portland is “far off” from hitting the next climate target.
“That means we have to achieve another 29% reduction just in the next several years to get back on track,” he said. “That’s particularly concerning and definitely a big lift. So, I think it’s even more important that we have this data out and available to the public at a moment like this where so much is on the line.”
The top source of local carbon emissions is electricity, according to the dashboard.
The bureau plans to add more data to the dashboard in the coming years, including details about tree canopy and energy use. The Portland Clean Energy Community Benefits Fund also recently launched a dashboard detailing program progress.


