
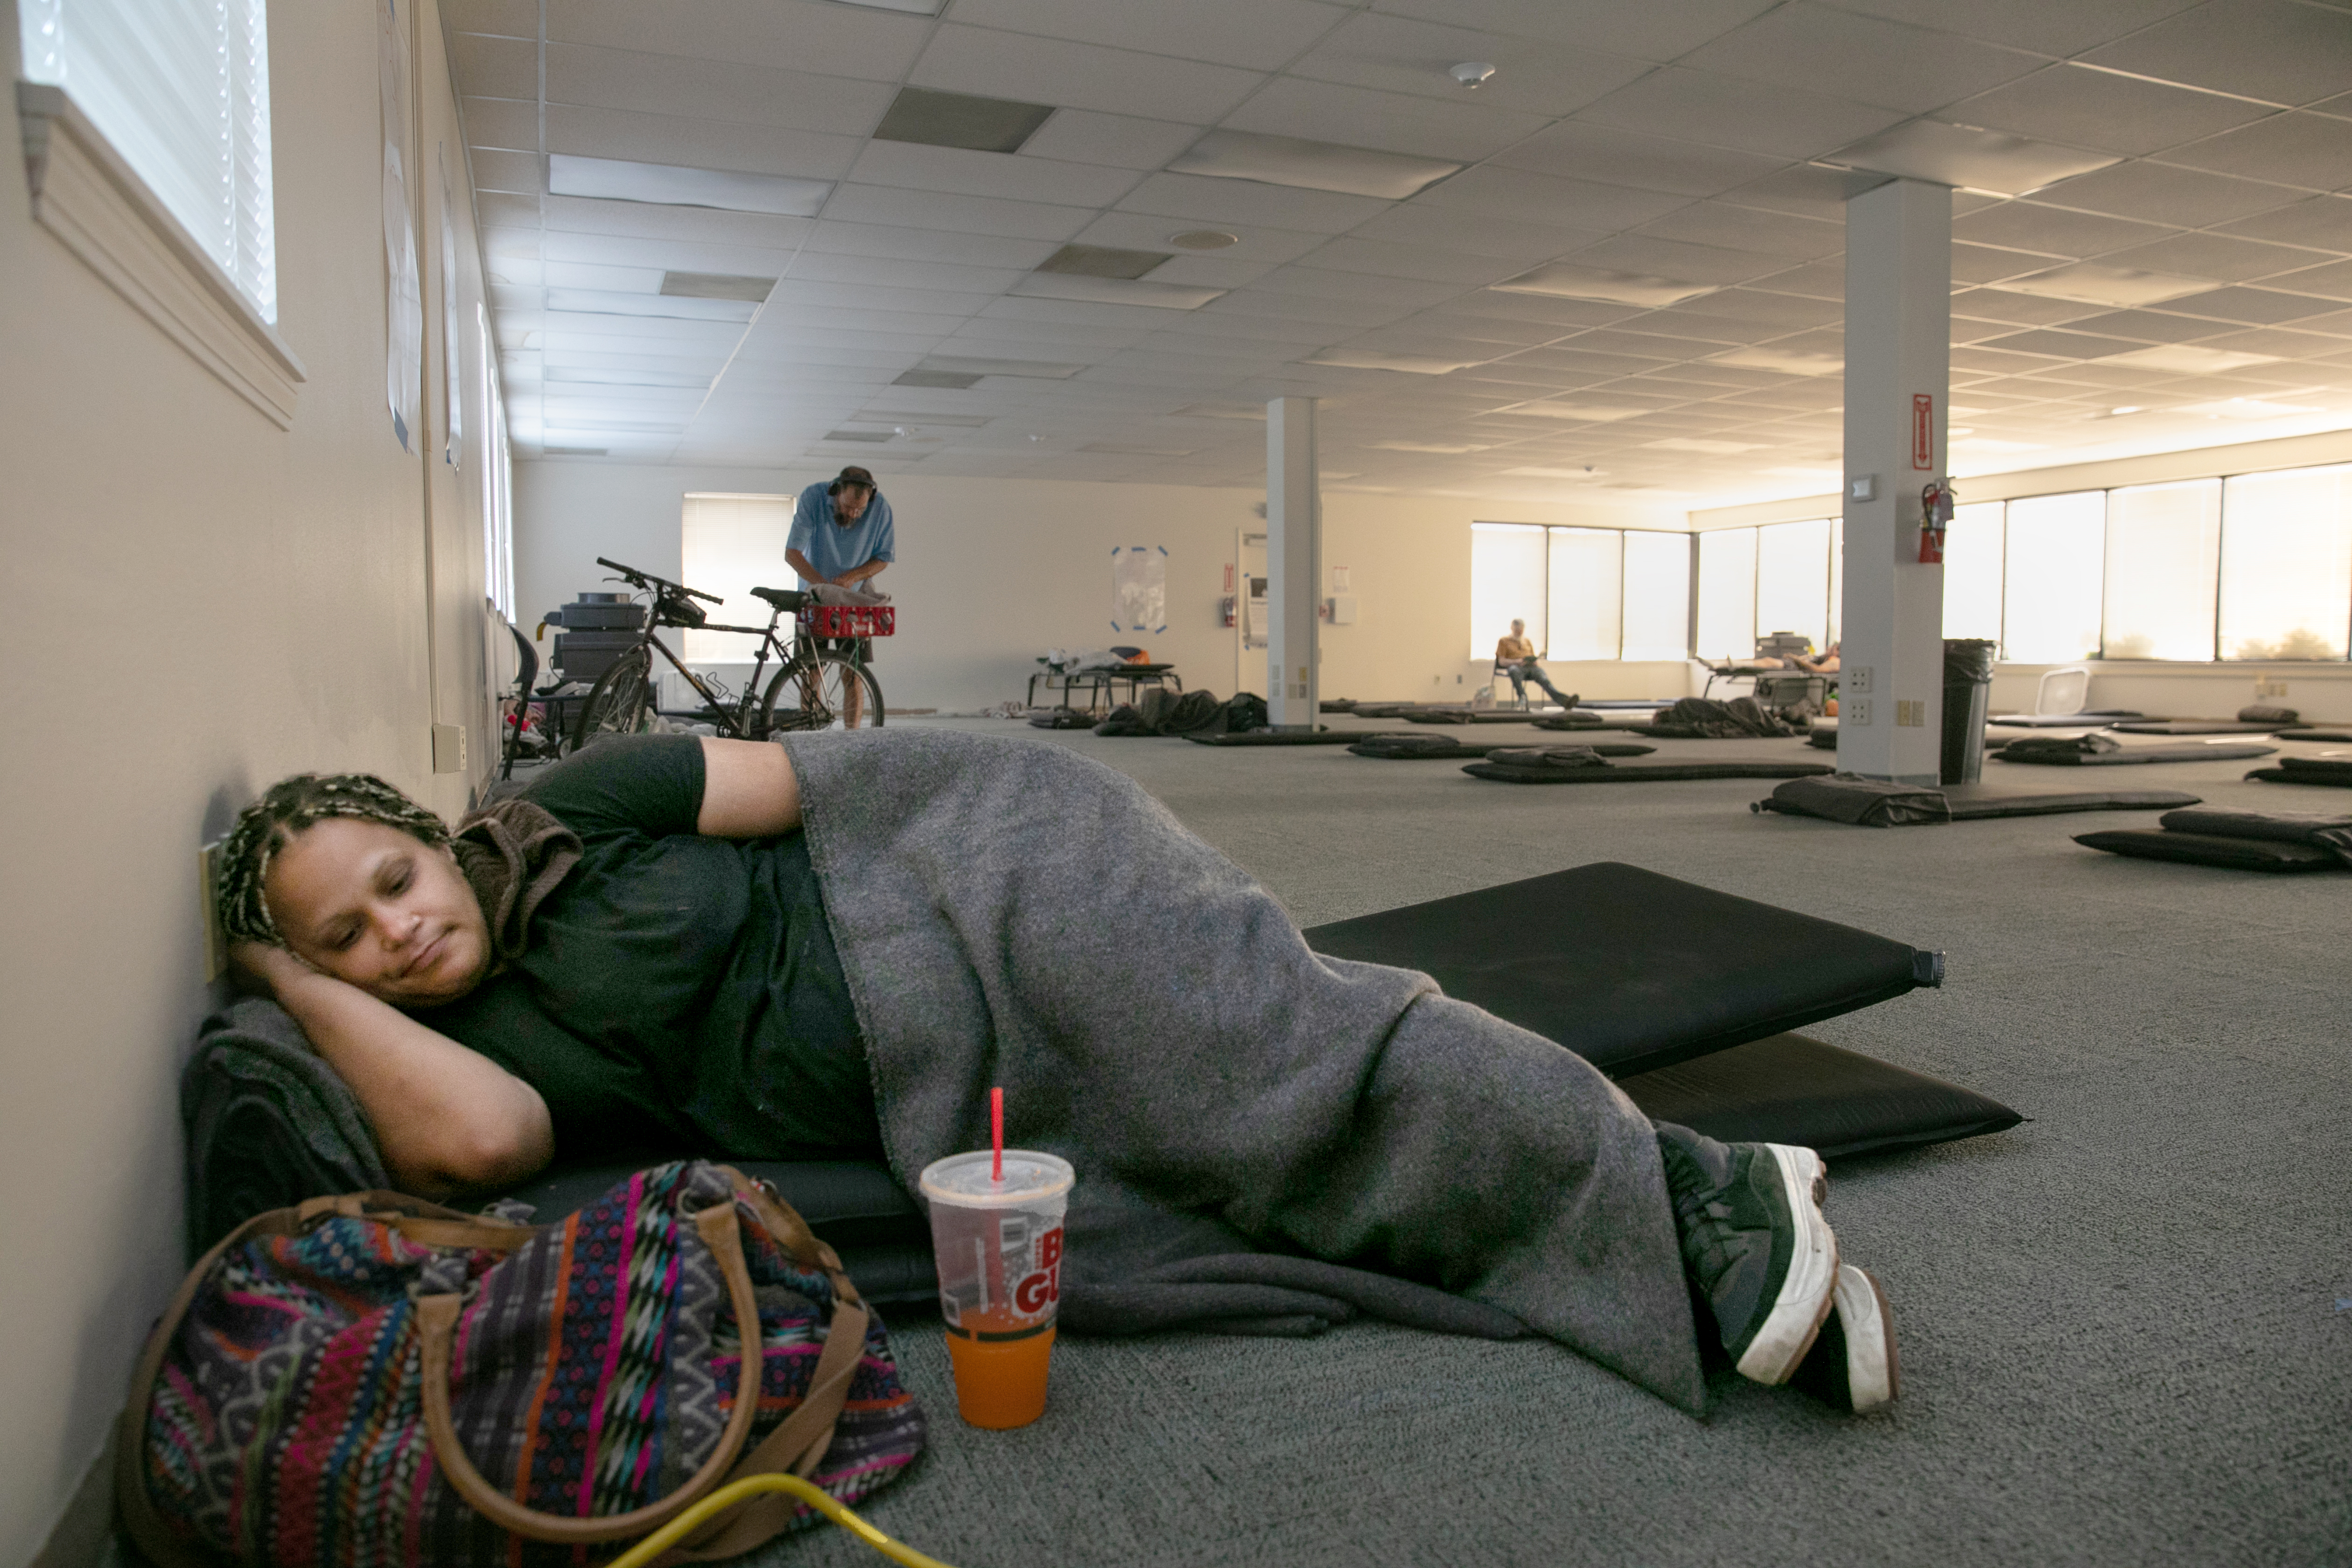
FILE - Rachawna Lee from Gresham rests in the sleeping area of the Cook Plaza cooling center in Gresham, Ore., on Aug. 15, 2023. NOAA's latest seasonal outlook indicates a hotter-than-usual summer in Oregon.
Caden Perry / OPB
The National Oceanic and Atmospheric Administration recently released a seasonal outlook that shows much of the United States will likely experience a hotter-than-usual summer, including in Oregon. And last year was already the hottest summer on record. What role is climate change playing in the seasonal outlook? How might they look different moving forward? We dig into these issues with Dan Collins, a meteorologist with NOAA’s Climate Prediction Center.
Note: This transcript was computer generated and edited by a volunteer.
Dave Miller: From the Gert Bole studio at OPB, this is Think Out Loud. I’m Dave Miller. Get ready for another hotter than normal summer. I’m saying that to everyone in OPB’s radio audience, from Long View to Lakeview, from Astoria to Ontario. And according to a recent seasonal outlook from the National Oceanic and Atmospheric Administration, the same could be said for almost every part of the contiguous U.S. This comes on the heels of the hottest summer on record, in 2023. Dan Collins is a meteorologist with the NOAA Climate Prediction Center. He joins us with the details. It’s good to have you on the show.
Dan Collins: Thanks, Dave.
Miller: The sense I get is the further out you go in terms of making weather predictions, the less certainty you have. How do you go about making projections for an entire three month period for a continent-sized country?
Collins: Well that’s true, that as you go further out, there is greater uncertainty, especially if you’re talking about what the day to day weather is going to be like. We make weather predictions out usually to about a week, six or seven days. But we are looking there at trying to predict the daily weather. If you’re predicting the long term averages, such as the season, we’re looking at three month averages. In this case, the most recent seasonal outlook is for June, July and August. So we’re really looking at the average conditions. And there are factors in the climate system that guide the system such that we could expect whether the three month average will be warmer than average or colder than average, or wetter than average or drier than average. So those slowly evolving aspects of the climate system that affect seasonal temperature allow us to make those predictions.
Miller: The map of the lower 48 shows varying levels of likelihood of higher than average temperatures. But in all but the Dakotas and a part of Minnesota basically, the entire map is projected to be higher than average. I have to say, I look at a map like this right now and sadly I think “yeah, that checks out.” But how unusual is a map like this if you’re looking back over the last 30 or 40 years?
Collins: Well, up until I believe it was eight years ago, we had not ever never predicted a map that was all tilted towards above normal temperatures. Previously, if you look back two or three decades ‒ we’ve been doing these forecasts for multiple decades ‒ there would be above normal and below normal. We make the assessment of whether it’s above or below normal by looking at a 30 year period. And currently that period is 1991 to 2020. So we’re trying to compare to that period and decide whether it’s above or below normal relative to that 1991 to 2020 period.
But, in recent years, since you’re always looking back to see what the climate is, the climate is changing, and therefore in those recent years ‒ like I said, in the last eight or 10 years ‒ more and more of the map is showing above normal across the entire United States. It’s actually not that unusual anymore that our maps look something like the current outlook. And as I said, eight years ago and several times since, we’ve had outlooks in which the entirety of the lower 48 states has been tilted towards chances of above normal.
Miller: Last summer, as I noted, was the hottest in the northern hemisphere on record since records began according to NASA. Is part of your projection to say whether or not an even hotter summer is likely?
Collins: We don’t really have the tools to say if it’s going to be a hotter summer than the record setting kind of temperatures or more extremes that we had in the past year or in recent years in particular. What we can say is that the increase in chances of above normal for the season for temperatures does mean that there is an increased chance of more extreme temperatures than we would have had in the previous period that we’re looking at for long term averages. So that’s growing, and that’s indicated somewhat by the tilt in the odds, the increase in chances for above normal temperatures. But we’re not specifically able to predict at this time whether or not we’ll match the kind of temperatures that we had, say, last year.
Miller: I think we’re all used to seeing weather maps where darker colors mean higher temperatures. But that’s not what this map is illustrating. Here, darker colors mean a higher likelihood that a given area is going to be hotter than normal. I’m wondering just how much we can infer from that? Does that also mean that higher highs are likely, if that question makes sense?
Collins: Well, it’s a little bit complicated I guess as to what you might expect during the season. It does mean that you might have more temperatures that are near record temperatures. We’re always going to have some records. We’re always going to have some more extreme temperatures during a season. That’s been true all along. But as we tilt more towards likely above normal temperatures for the season as a whole, then you’re going to have more periods, longer periods of more extreme temperatures, of hotter temperatures. This is something that we know from observations, that periods of high heat and extreme temperatures are lengthening during different seasons, summer seasons in particular. And also the regions which are impacted by more extreme temperatures are increasing.
Miller: Let’s turn to some of the particulars here. Eastern Oregon is more likely to be hotter than normal than western Oregon. The southwestern U.S. has the highest likelihood of being hotter than normal. And as I noted, the upper Midwest is the only place in the country that’s projected to have normal temperatures. What accounts, broadly, for these regional variations?
Collins: Well, primarily the answer is what are the regional impacts of climate change? How are temperatures changing over the last several decades? This is something that we look at and that we use in our tools for forecasting the seasonal temperatures. We look at other factors as well. El Nino and La Nina, the cycle of sea surface temperatures in the eastern tropical Pacific, those play an important role and always have played an important role. But more and more, the answer is really long term climate change plays an increasing role in how likely is it to be above normal temperatures.
So the trends in temperature, the changes in temperatures over recent decades, those are strongest in the southwest. That is definitely a part of that reason that we have a higher probability in the southwest. They’re also strong across much of the west, where you see that the probability of above normal temperatures exceeds 50%. The way we do this is we divide it into “above”, “near”, and “below”, three categories with a one-third chance of each in that period that we’re comparing to. But in recent years, we see much more often above normal temperatures in these regions. And therefore, the probability of above normal temperatures in those regions has increased.
In short, we’re looking at the regional, spacial impacts of climate change, as well as some impacts of whether we have El Nina and La Nina and some other local factors.
Miller: What about precipitation, in the west, in particular?
Collins: Well, in the west, the outlook has an increased chance of below normal precipitation, across much of the west. Actually, the areas that are cut out from the map that don’t show an increased chance of below normal in California and parts of the Southwest, those are the most arid regions, the drier regions during the summer months. And so it’s harder to predict that it would actually be below normal when it’s very dry there already. So really, we’re forecasting a somewhat dry western United States in the outlook. And that includes Oregon.
Miller: Dan Collins, thanks very much.
Collins: You’re welcome.
Miller: Dan Collins is a meteorologist with the NOAA Climate Prediction Center.
Contact “Think Out Loud®”
If you’d like to comment on any of the topics in this show or suggest a topic of your own, please get in touch with us on Facebook, send an email to thinkoutloud@opb.org, or you can leave a voicemail for us at 503-293-1983. The call-in phone number during the noon hour is 888-665-5865.


