
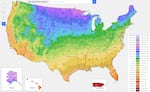
This image from the U.S. Department of Agriculture shows the agency's new plant hardiness zone map updated on Wednesday, Nov. 15, 2023. The map was updated for the first time in a decade, and it shows the impact that climate change will have on gardens and yards across the country.
USDA via AP / AP
If you’re an avid gardener who pursues your passion all year round, you may be familiar with a handy guide commonly found at nurseries that tells you if the azaleas, rhododendrons, or other perennials you’re thinking of planting in your garden are likely to survive the winter. The Plant Hardiness Zone Map is divided into 13 temperature zones and half-zones, stretching from frigid Alaska (1a) to tropical Puerto Rico (13b), and is based on a 30-year average of the coldest winter temperatures recorded for each zone.
Earlier this month, the USDA released the latest version of the interactive map which was co-developed by researchers at the PRISM Climate Group at Oregon State University. An update to the 2012 map, the new version shows an average nationwide shift of 2.5 degrees Fahrenheit, which may indicate warming temperatures due to climate change, among other factors. Chris Daly is the lead author of the new map, the founding director of the PRISM Climate Group and a professor in the college of engineering at Oregon State University. He joins us to talk about developing the map, what it means for Oregon growers and the impact of a changing climate on the winter growing season.
The following transcript was created by a computer and edited by a volunteer:
Dave Miller: This is Think Out Loud on OPB. I’m Dave Miller. Earlier this month, the US Department of Agriculture released the latest update to the Plant Hardiness Zone Map. It’s based on a 30 year average of the coldest winter temperatures recorded all around the country. It tells you what plants or shrubs are likely to survive where. The latest version of the map was co-developed by researchers at the PRISM Climate Group at Oregon State University. It charts an average nationwide increase, a shift of 2.5°F. Chris Daly is the lead author of this new map. He’s the founding director of the PRISM Climate Group and a professor in the College of Engineering at Oregon State University. He joins us now. Welcome to the show.
Chris Daly: Thanks, Dave. Good to be here.
Miller: How do people use this map?
Daly: Well, I think probably the best way to describe it would be that if you are a gardener and you like to grow perennial plants…these are plants that over winter usually last for many years, such as azaleas, rhododendrons, camellias, and trees as well, they’re accompanied in your nursery by a tag. And a tag will have a zone that that plant is rated to. For example, in the Willamette Valley here we’re zone 8B. the idea would be that if that plant is rated to zone 8B or lower, which would be a colder extreme minimum temperature, then you’re likely to be able to successfully grow that plant in your garden. So plant breeders and nurserymen, they always make sure to have those tags available to the gardener so they know what they’re getting into when they buy that plant.
Miller: Why focus on extreme low temperatures as opposed to extreme highs?
Daly: Well, it’s a good question. First of all, I should say that the map is only focusing on low temperatures. And that has been a tradition at the USDA for a number of years. In fact, these variations of these map go back about 100 years or so. And I think the idea was “OK, we’re going to focus just on one aspect of plant survival, and that is overwintering cold winters, to see if a plant can survive that,” because it really has a lot to do with whether someone is spending a lot of money on plants and finds that they don’t make it.
I think though that we need to be cognizant of the fact that there are many other factors that will influence whether a plant can survive in your garden. Our summers are getting hotter and drier and longer. Our drought period during the summertime is extending due to climate change. And so all these things will have a lot of effects as to whether a plant will survive. But this is a major factor that’s very important.
Miller: What is different about the way this map was put together from earlier editions in previous decades? And we can also talk about the shifts that it actually charts. But what was different about the way you created it?
Daly: So we came onto the scene for the 2012 release and we worked with the USDA in the 20-aughts to develop that map. And that was the first time that the map became digital. Before that it was done mostly with kind of manual, subjective methods, even hand drawn methods. So we really didn’t have a very detailed map to work with. And so by working with USDA, we made it clear that we had the technology with our PRISM modeling to be able to do this map in a much more detailed and digital way.
So in terms of what has changed from the 2012 map to the 2023 map, we’ve brought in a lot more data. We have data from over 13,000 stations this time compared to under 8,000 last time. And part of the reason for that is that we’ve now aligned the averaging period of this map to be the same as that for the official climate normals, which is 1991 through 2020. That normal period moves forward once a decade with a year ending in zero. So when we get to 2001 through 2030, that will be the next normal period. And in the process of mapping those normals, we were able to do a lot of work to bring in a lot more data.
Also, we’re always on a tear to try to improve our modeling techniques. And we do that pretty regularly. This time, the 2023 map, we’ve improved our simulation of zonal changes along coastlines and especially at higher elevations.
A thing that needs to be understood is that the plant hardiness statistic is really recording an extreme event. So it’s the coldest night of the year every year, so you’ve got 30 numbers to work with. So that’s a pretty volatile number that changes a lot depending on whether you get that big cold air outbreak from Canada or whether you don’t. So some of the changes that we’ve seen may also be due to the luck of the draw in terms of what years you are now in the averaging period and what years have been left out.
And finally, of course, some of the changes are due to climate change. I think we know for a fact that average temperatures are rising due to climate change. Over the long term, this should cause plant hardiness zones to gradually move northward. But many areas of the southwest showed some cooling too. So it’s not that straightforward. Over the shorter term, we don’t have a good understanding of how the frequency, intensity, and timing of these events would bring us the coldest temperatures of the year in a warming world. There’s some talk about, we may see increased volatility in our weather patterns…
Miller: Meaning, if I understand, even if the average temperature over the course of a year is going up, there may be even more extremes, there might be a colder low on one single night, right?
Daly: That’s correct. I think about the 2021 so-called “polar vortex” that went down into the central part of the country and froze Texas. Those situations may become more frequent. We don’t, we’re not really sure, but it’s possible that we would get more flow coming out of the north from the Arctic Canada. All it takes is one cold night, and that’s recorded for that year.
Miller: It really shows in a very clear way the challenges of a single map or a single tag on a rhododendron at some nursery when we’re talking about both a warming world and a more volatile climatological world. It just makes me wonder if we’re just collectively putting too much stock in a single map.
Daly: Right, I couldn’t agree more. It is just one single map. And even in a climate that’s relatively stationary, which ours appears to be not, it’s only looking at the average coldest night of the year over 30 years, and it doesn’t tell you how cold it will be, or how cold it has been. You can still get those extremely cold temperatures.
I think typically what you’ll hear garden centers council gardeners is that you might not want to push your zones too far. That is if you are in zone 8B, like we are here in the Willamette Valley, maybe it might be a good idea to go down a couple of zones and look for plants that are adapted to six zone 6 rather than zone 8.
Miller: So meaning, imagine you are in California as opposed to the Willamette Valley?
Daly: That’s right. So you would say, OK, let’s see if we can find something that we know will survive colder temperatures then what we typically experience here in case you do get that cold snap that could really damage your plants.
Miller: Oh! Then maybe I was going in the wrong direction. You’re saying plant things as if we were in a place that has colder temperatures, even though we live in a warming world.
Daly: Right. It may be that that’s what we see. I think, as I mentioned in the long run, climate change will start to warm things up. If you think about it, given a cold air outbreak from Canada, that source area that source air up in Canada will be warming as well. But we really don’t know how those weather patterns that bring those cold temperatures will vary in the future with climate change.
Miller: For things like flood maps, there can be some pretty serious financial repercussions based on where the lines are drawn, especially for things like insurance. Is there anything comparable for a plant hardiness map?
Daly: I think there’s probably a couple of things. The first thing is that there is a lot of money at stake when plant breeders breed plants. And they do their testing in gardens to see what types of cold temperatures these perennial plants that they’re developing can tolerate. And I think that they don’t want those plants to fail. There are a number of stores and outlets that simply will send plants back to them if they don’t work out. So there is a lot of horticultural money involved in making sure that these maps are accurate.
But we do have the issue of the zones. We’re talking about 10° zones and 5° half zones as you mentioned in your intro. But 5° is a lot, and all you need if you’re on the edge of a zone, for example, if you’re very close to the next warmest zone, and the map says you’ve moved 1°F a little warmer that could plunk you into a new half zone. It’s not really that important, but people see these divisions and think “oh my goodness, I’ve just changed a half zone, and that means I can start planning a bunch of new plants.”
I think also that on the insurance side, the USDA Risk Management Agency, the RMA, who administers the federal crop insurance program also pays close attention to the map, especially when it comes to insuring losses from nurseries.
Miller: You mentioned early on that the map about 11 years ago, it was the first time that it was made digitally as opposed to, in some cases, people literally using hand drawn aspects of it. What about people using it digitally? I mean, will this work on folks’ cell phones?
Daly: Yeah, that’s a really interesting question. We’ve seen a big change in how people are accessing the map this time. We’ve literally had hundreds of thousands of people access the map in the past week or so. And this time, people are using their smartphones, which did not occur in 2012. I think what’s happening is that people are clicking on links from stories that they see online talking about the map. And because the smartphone real estate is not very large, you can’t see the actual map. It’s just not possible to render that map in such a small space. So what you do get is a zip code finder. And you can enter your zip code, and see what the plant hardiness zone is for your location, or any other location where you happen to know the zip code.
And I think some people don’t know about the actual website, they just are seeing what they’re seeing on their phone and nothing more. So hopefully the word will get out that there is a website that has a big interactive map and a number of static state maps you can download. So there’s quite a number of images and utilities that you can look at on the actual website.
Miller: I mentioned that you are the founding director of the PRISM Climate Group at OSU which is all about mapping and climate change. What are you excited to be working on next in terms of this intersection of a graphical understanding of the world and a warming world?
Daly: Well, I think we’re constantly kind of digging in and trying to create maps that are at higher resolution and in greater detail and in greater accuracy. My background spans a pretty unique combination of disciplines, meteorology, climatology, geography, ecology, modeling. And so I’m really interested in being able to create maps that describe what the environment is like at a particular location just as accurately as possible. We are ones where we don’t focus on projections of climate change into the future. We’re more about being able to describe accurately what’s happened in the past. And so there are a lot of issues in terms of weather stations coming and going and shifting positions and quality control of data where we’re trying to work on ways to try to bring some of this old data to the floor into our mapping process and make them as accurate as possible, both spatially and temporarily.
Miller: Chris Daly, thanks very much.
Daly: Thank you.
Miller: Chris Daly is a professor in the College of Engineering at Oregon State University, where he is the founding director of the PRISM Climate Group. He’s also the lead author of the new Plant Hardiness Zone Map.
Contact “Think Out Loud®”
If you’d like to comment on any of the topics in this show or suggest a topic of your own, please get in touch with us on Facebook, send an email to thinkoutloud@opb.org, or you can leave a voicemail for us at 503-293-1983. The call-in phone number during the noon hour is 888-665-5865.